This tutorial provides step-by-step instructions on how to use the EnrichNet web-application to
identify, prioritize and analyze functional associations between user-defined gene or protein sets and
cellular pathways using information from molecular interaction networks.
1. Introduction and feature overview
One of the most common tasks in the analysis of gene and protein lists obtained from an experiment or from the literature is the assessment of putative
functional associations between these genes/proteins and known cellular processes, pathways and complexes.
Classical approaches to address this problem are overrepresentation-based enrichment analysis methods, which evaluate
the significance of the overlap between gene or protein sets using a statistical test like the one-sided Fisher's exact test.
EnrichNet is a web-application that complements this classical overlap-based enrichment analysis by a new association measure that integrates information from the known network structure of interactions between proteins. In comparison to other approaches, it provides the following benefits:
- EnrichNet can score functional associations between all gene/protein sets, even if the overlap size is zero (no genes/proteins are shared)
- EnrichNet can take into account implicit functional information on genes/proteins with missing annotations derived from molecular interaction data
- By taking into account the network structure of physical interactions between the gene/protein sets, EnrichNet does not only provide a ranking table of putative associations but enables a visual exploration of the results in an interactive network visualization
- Using tissue-specific gene expression data from the GNF Atlas, EnrichNet can compute tissue-specific association scores across 60 different tissues in the human species
- EnrichNet is not tied to a single data source for network or pathway definitions, but provides a choice between six different pathway/process databases (KEGG, BioCarta, Reactome, WikiPathways, Gene Ontolgy, NCI Pathway DB) and enables the user to upload self-defined human gene/protein interaction networks
More details about these features and the corresponding web-interfaces are explained in the following sections.
2. Quickstart guide
To obtain a first impression of how to use
EnrichNet and see the different features and result types for an analysis, the user can choose one of the example datasets in the drop-down menu on the main user interface (top of the page, see Figure 1), select a database of pathway/process definitions
in the next step (see Figure 2) and simply click the "Start analysis" button at the bottom of the page.
Figure 1 a): EnrichNet main interface - users can choose a pre-defined interaction network (or a self-defined network using the "Upload new network" option) and copy & paste a list of gene or protein set identifiers of interest into the text area at the bottom of the page.
Figure 1 b): EnrichNet main interface (step 2) - users can select one of the pathway databases to identify associations of their self-defined gene/protein set with the process definitions in this database.
To analyse a self-defined gene or protein set, the user can copy and paste the identifiers into the text box at the bottom of the page (one identifier per line),
and choose the corresponding identifier from the drop-down box at the top of section 2 (the supported identifiers include HGNC gene symbols, ENSEMBL identifier, ENTREZ gene identifiers, and probe identifiers for common human microarray platforms, among others).
The maximum size for the target gene/protein set is 1000, however to obtain both robust and specific results,
we recommend to use the approach with dataset sizes between 10 and 500.
The user can map the gene/protein list and pathways either onto a pre-defined functional interactome from the STRING database (option "STRING network"),
onto a network assembled from multiple interaction databases by Bossi & Lehner (option "Bossi & Lehner network"), or upload a self-defined interaction network
in ENSEMBL gene format.
After submiting a job, the user is re-directed to an automatically updating waiting page, where an e-mail notification can be set up, while the submitted job is being processed. The user will then be notified, when the job is complete. Alternatively, a bookmark can be set to return to
the results notification page at a later time. As soon as the job has been processed, a hyperlink to the
results page will appear.
The results include an interactive ranking table, showing which pathways have prioritized for a putative functional association with the user-defined gene set in terms of a network-based association score (the Xd-score) and a classical overrepresentation-based score using Fisher's exact test.
The sorting features of this table as well as the possibility to create interactive sub-network visualizations for selected pathways can be explored independently by the user, or alternatively, the tutorial sections 4 and 5 will provide more details on the possibilities to inspect the results of an analysis.
3. Uploading your own interaction network data
For a standard analysis of a gene or protein list, using a pre-defined human protein-protein interaction network, the user only needs to copy and paste the gene/protein identifiers of interest into the text box at the bottom of the main web-interface. However, if the user wishes to analyze potential gene set associations with cellular pathways in the context of a self-defined regulatory or interaction network, the hyperlink "Upload new network" in the "Select network" section leads to a corresponding interface (see Figure 2).
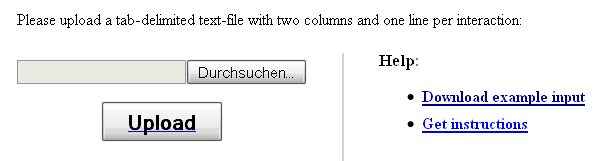
Figure 2: Interface for uploading a user-defined interaction network
The network file uploaded on this interface has to be provided in a two-column flat-file format (also known as edge list-format), where column 1 specifies the first interactor and column 2 the second interactor (separated by a space or a tab), both in ENSEMBL gene format. For example
ENSG00000000938 ENSG00000080824
ENSG00000051180 ENSG00000002016
ENSG00000179348 ENSG00000005339
ENSG00000134058 ENSG00000008128
ENSG00000072274 ENSG00000010704
...
would be the beginning of a valid network file, where all genes/proteins are in the same format.
Please note: The uploaded network must contain a
single connected component, since distances cannot be computed in disconnected graphs.
After clicking the "Upload" button, the user will be forwarded back to the main web-interface, where a gene/protein list of interest can be specified in one of the supported identifier formats before finally submitting the job by clicking the "Start analysis" button.
To facilitate the preparation of the input data, the network upload interface provides a link to an example network data file, which can be used as a template.
Please
contact us, should you experience any kind of problems when uploading or analyzing your data.
4. Ranking of pathways in terms of network interconnectivity with mapped gene/protein sets
Please
click here to see a real interactive example results page, including EnrichNet pathway rankings and network visualizations, which have been generated using the list of known human cancer-mutated genes as input (Futreal et al., 2004), the pathway definitions from the KEGG database and a protein-protein interaction network from the STRING 9.0 database (here: using interactions with combined score >= 600). In the following, a general description of the pathway ranking results provided by EnrichNet will be provided.
The main output generated by EnrichNet after analyzing a user-defined gene/protein set is a ranking of pathways in a selected database (the
Kyoto Encyclopedia of Genes and Genomes (KEGG),
BioCarta,
WikiPathways,
Reactome,
NCI Pathway Interaction DB,
InterPro or
Gene Ontology) in terms of their estimated functional association with the user's gene/protein set. This quantitative association estimate is obtained by mapping both the user-defined dataset and the pathway datasets onto a molecular interaction network and compupting network-based gene/protein set enrichment scores using the automatic procedure outlined in the EnrichNet manuscript.
On top of the results page, which contains the resulting ranking table of pathways sorted by decreasing Xd-score, a menu will be shown that allows the user to either jump to the sections of interest in the web-based interactive representation of the results (buttons 1 and 2) or to download the results directly (buttons 3 and 5, see Figure 3).

Figure 3: The results page menu
Clicking the first button leads to the interactive pathway ranking table (see Figure 4), which provides access to both classical and network-based enrichment scores for the analyzed pathways, tissue-specific association scores, as well as the possibility to compute graph visualizations of the network interconnectivity between the user-defined gene/protein set and chosen pathways.
Figure 4: The pathway similarity ranking table (only the first two rows for an example ranking of KEGG pathways against the Futreal cancer gene set are shown)
In the first table column, the pathway identifiers are shown, including hyperlinks to display the gene identifiers that were successfully mapped to the pathways. More importantly, by clicking on the
compute graph visualization option, a network visualization of the mapped pathway and the user-defined gene set will be generatd ed and displayed in a new window (please deactivate pop-up blockers for this purpose, see section 5 "Visualization of sub-networks representing pathway/gene set associations").
The second column shows the network similarity scores (Xd-scores), which measure the network interconnectivity between the user-defined gene/protein set and the cellular pathways/processes mapped to the molecular interaction network. In order to compare this score to a classical overlap-based enrichment analysis score, the significance of the gene set overlap between the pathway and the user-defined gene set is measured by the Fisher exact test and shown in the 3rd column. Moreover, the number of genes/proteins in the uploaded and mapped user-defined gene/protein set, the mapped pathway and their intersection set is shown in the next three columns. Finally, in order to see how the corresponding XD-score differs when restricting the molecular interaction network to different human tissue-types, a bar plot and a table of tissue-specific XD-scores for each pathway can be displayed by clicking on the corresponding hyperlinks in the last table column.
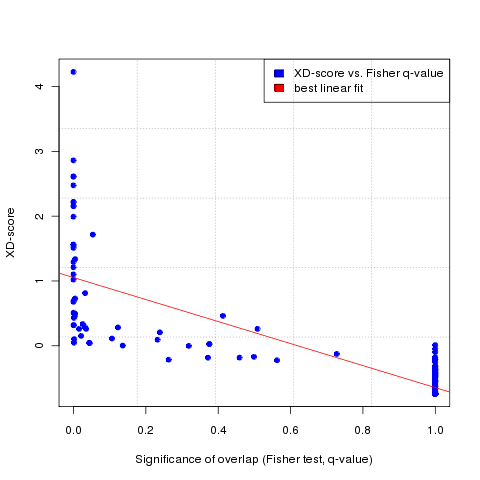
In order to choose a significance cut-off for the Xd-scores, to select only pathways exceeding a certain minimum association score with the user-defined gene/protein set, a regression plot at the bottom of the results page (accessible via button 2 in the results menu, see Figure 3, and Figure 5 for the regression plot) relates the XD-score to the significance score for the classical overlap-based Fisher test (a p-value adjusted for multiple testing using the Benjamini-Hochberg method, also called q-value here). The plot and the absolute Pearson correlation between the Xd-scores and Fisher q-values (shown on the right of the ploat) enables the user to determine the goodness of the linear fit between the two scoring lists, which can be used to choose a significance threshold for the XD-score (by default, this is the regression fit equivalent of the Fisher q-value of 0.05 + the lower bound corresponding to the 95% confidence intervall for the linear fitting (shown at the bottom of the table on the right of the regression plot). By hovering the mouse over the data points, a label with the name of the corresponding pathway will appear above the plot (after a small delay, depending on the used browser - the functionality can be tested on Figure 5 below).
|
|
|
Absolute Pearson correlation between XD-scores and Fisher q-values:
|
0.82
|
XD-score significance threshold:
(reqression fit equivalent to Fisher q-value of 0.05
+ upper bound of 95% confidence interval for linear fitting)
|
1.11
|
|
Figure 5: Regression plot of the network-based scores (Xd-scores) against the overlap-based scores (Fisher exact test q-values, obtained using KEGG pathways and the Futreal cancer gene set)
When having chosen a pathway of interest whose Xd-score (or one of its tissue-specific Xd-scores) exceeds the desired cut-off score, the user can analyze the pathway and its network interconnectivity with the user-defined gene/protein set in more detail by clicking on the corresponding
compute graph visualization link in the pathway ranking table. This will generate a new web-page containing an interactive network visualization of the mapped genes/proteins in the pathway and the user-defined gene set, which enables a detailed exploration of the direct interactions between corresponding proteins and their annotations and network properties (see next section, "Visualization of sub-networks representing pathway/gene set associations").
5. Visualization of sub-networks representing pathway/gene set associations
Please
click here to see a real interactive example visualization, showing a sub-network from a protein-protein interaction network obtained from the STRING 9.0 database (here: using interactions with combined score >= 600) for a mapped gene set of Parkinson's disease related genes (obtained from a microarray gene expression study, blue nodes) and genes/proteins from the
Alpha-synuclein signaling pathway in the NCI pathway database. The next paragraphs will describe the features of the EnrichNet sub-network visualization in general.
When analyzing a gene/protein set with classical enrichment analysis methods, the user typically only obtains a ranking list of pathways/processes as output, indicating which pathways are most likely to have a functional assocation with user's gene/protein of interest. To enable a more in-depth exploration of a gene set/pathway association, as a complement to this ranking table, EnrichNet provides a network visualization for each pathway that appears in the ranking, acessible via the
compute graph visualization link in the first column in the results table. Clicking this link will generate a new browser page that contains a graph visualization of the user's gene/protein set (blue nodes), the selected pathway (red nodes) and their shared nodes in a molecular interaction network (by default, a human protein-protein interaction network). The visualization consists of a force-directed graphic layout of the sub-network containing the user-defined genes and the pathway nodes, as well as the direct interactions connecting these nodes (see Figure 6, left). Moreover, a menu on the right of the visualization displays all gene/protein names in ENSEMBL and HGNC gene symbol format (with text colors representing the membership of a gene/protein in the user's gene set, the pathway or the intersection set) and allows the user to search for a gene of interest and highlight it in the map by clicking on the corresponding identifier (see Figure 6, right).
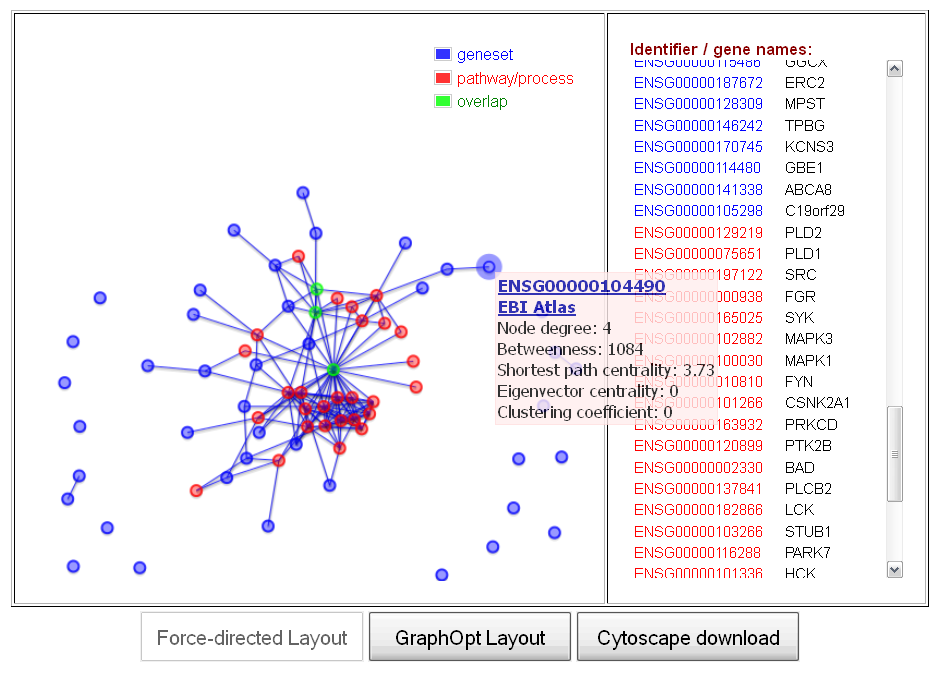
Figure 6: Interactive web-based visualization of sub-networks representing the user-defined gene set, a selected cellular pathway and their shared nodes (overlap) in the molecular interaction network (the example shows a set genes associated with Parkinson's disease (blue) and the Alpha-synuclein signaling pathway from the NCI pathway database (red) and their overlap (green))
Within the network visualization, several interactive features can be used to explore the data. By using the mouse scroll wheel or clicking on empty areas of the plot, the user can zoom into the plot, which can facilitate the analysis of graph regions with densely clustered of nodes for large gene/protein sets. Moreover, by clicking on the node for a certain gene/protein, a menu will be displayed, providing information on the network topological properties of the node (e.g. the degree, clustering coefficient, and various node centrality measures) and a hyperlink to an external functional annotation database, containing detailed biological information about the selected or gene/protein. A mouse-click on a node will also highlight the corresponding gene/protein identifier in the menu on the right of the visualization, enabling the user to quickly retrieve the identifiers for a selected set of nodes.
Below the network graph, the buttons
Force-directed Layout and
GraphOpt Layout can be used to generate different automatic graph layouts for the network (or simply to reset an initally selected layout, after zooming into the plot).
Finally, the button
Cytoscape download provides access to a zip-file containing the visualized network in edge list format and the node labels in the Cytoscape node attribute file format. The user can import these files into the widely used freeware visualization software
Cytoscape, to explore the downloaded sub-network in more detail on the user's own computer.
6. Troubleshooting (system requirements & browser compatibility)
EnrichNet is compatible with any recent version of a Javascript-enabled web-browser on common 32-bit
operating systems (Windows, Linux and MacOS). The webpage is optimized for a screen resolution of 1280x1024, but has been tested successfully on various systems with higher resolution.
No plug-ins are required to display the results, but to explore downloaded networks in detail, the user might want to install the
Cytoscape network visualization software.
Should you experience any problems when displaying the web page or downloading results, please
contact us.