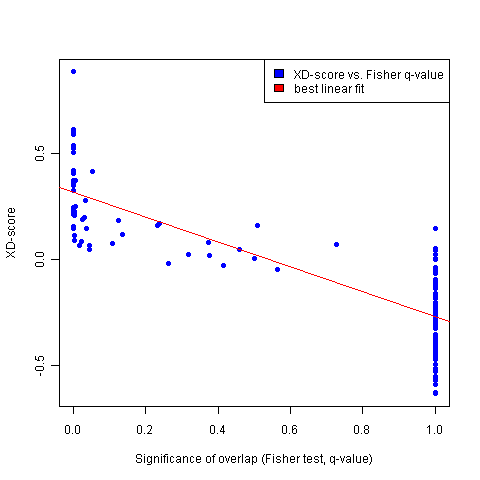
Annotation (pathway/process)  | Significance of network distance distribution (XD-Score) |
Significance of overlap (Fisher-test, q-value) |
Dataset size (uploaded gene set) | Dataset size (pathway gene set) | Dataset size (overlap) |
Tissue-specific XD-scores |
|---|
hsa05216:Thyroid cancer  | see mapped genes |
| 0.88266 | 3.0e-11 | 338 | 29 | 16 (show) | |
hsa05213:Endometrial cancer | see mapped genes |
| 0.61247 | 4.1e-11 | 338 | 51 | 19 (show) | |
hsa04320:Dorso-ventral axis formation | see mapped genes |
| 0.60335 | 2.4e-06 | 338 | 25 | 10 (show) | |
hsa05219:Bladder cancer | see mapped genes |
| 0.59163 | 1.8e-09 | 338 | 43 | 16 (show) | |
hsa05218:Melanoma | see mapped genes |
| 0.58852 | 5.4e-14 | 338 | 70 | 25 (show) | |
hsa05214:Glioma | see mapped genes |
| 0.53616 | 2.8e-11 | 338 | 64 | 21 (show) | |
hsa05220:Chronic myeloid leukemia | see mapped genes |
| 0.53269 | 1.7e-13 | 338 | 76 | 25 (show) | |
hsa05221:Acute myeloid leukemia | see mapped genes |
| 0.53257 | 9.5e-10 | 338 | 56 | 18 (show) | |
hsa05215:Prostate cancer | see mapped genes |
| 0.52294 | 1.5e-14 | 338 | 87 | 28 (show) | |
hsa05223:Non-small cell lung cancer | see mapped genes |
| 0.50436 | 5.8e-09 | 338 | 56 | 17 (show) | |
hsa05211:Renal cell carcinoma | see mapped genes |
| 0.41875 | 6.0e-08 | 338 | 68 | 17 (show) | |
hsa05210:Colorectal cancer | see mapped genes |
| 0.41721 | 2.9e-10 | 338 | 86 | 22 (show) | |
hsa00720:Reductive carboxylate cycle (CO2 fixation) | see mapped genes |
| 0.41268 | 5.3e-02 | 338 | 11 | 3 (show) | |
hsa05212:Pancreatic cancer | see mapped genes |
| 0.40528 | 6.1e-09 | 338 | 75 | 19 (show) | |
hsa04115:p53 signaling pathway | see mapped genes |
| 0.37189 | 3.2e-06 | 338 | 62 | 14 (show) | |
hsa00020:Citrate cycle (TCA cycle) | see mapped genes |
| 0.36926 | 4.7e-03 | 338 | 26 | 6 (show) | |
hsa04662:B cell receptor signaling pathway | see mapped genes |
| 0.35671 | 1.2e-05 | 338 | 60 | 13 (show) | |
hsa04012:ErbB signaling pathway | see mapped genes |
| 0.34495 | 2.7e-07 | 338 | 88 | 18 (show) | |
hsa04660:T cell receptor signaling pathway | see mapped genes |
| 0.32508 | 4.6e-07 | 338 | 92 | 18 (show) | |
hsa05040:Huntington's disease | see mapped genes |
| 0.27495 | 3.2e-02 | 338 | 29 | 5 (show) | |
hsa04150:mTOR signaling pathway | see mapped genes |
| 0.24616 | 4.8e-03 | 338 | 49 | 8 (show) | |
hsa05222:Small cell lung cancer | see mapped genes |
| 0.24139 | 1.1e-04 | 338 | 88 | 14 (show) | |
hsa04110:Cell cycle | see mapped genes |
| 0.22700 | 2.1e-04 | 338 | 108 | 15 (show) | |
hsa04664:Fc epsilon RI signaling pathway | see mapped genes |
| 0.22627 | 4.1e-03 | 338 | 73 | 10 (show) | |
hsa04630:Jak-STAT signaling pathway | see mapped genes |
| 0.21518 | 2.3e-07 | 338 | 146 | 23 (show) | |
hsa04520:Adherens junction | see mapped genes |
| 0.21223 | 4.1e-03 | 338 | 73 | 10 (show) | |
hsa04916:Melanogenesis | see mapped genes |
| 0.21131 | 1.2e-03 | 338 | 100 | 13 (show) | |
hsa04210:Apoptosis | see mapped genes |
| 0.20727 | 3.0e-03 | 338 | 83 | 11 (show) | |
hsa04370:VEGF signaling pathway | see mapped genes |
| 0.19515 | 3.2e-02 | 338 | 70 | 8 (show) | |
hsa04720:Long-term potentiation | see mapped genes |
| 0.18834 | 2.6e-02 | 338 | 67 | 8 (show) | |
hsa04330:Notch signaling pathway | see mapped genes |
| 0.18228 | 1.2e-01 | 338 | 44 | 5 (show) | |
hsa01510:Neurodegenerative Diseases | see mapped genes |
| 0.16621 | 2.4e-01 | 338 | 38 | 4 (show) | |
hsa05030:Amyotrophic lateral sclerosis (ALS) | see mapped genes |
| 0.16082 | 5.1e-01 | 338 | 18 | 2 (show) | |
hsa05217:Basal cell carcinoma | see mapped genes |
| 0.15849 | 2.3e-01 | 338 | 54 | 5 (show) | |
hsa04510:Focal adhesion | see mapped genes |
| 0.15231 | 1.9e-05 | 338 | 196 | 23 (show) | |
hsa04920:Adipocytokine signaling pathway | see mapped genes |
| 0.14612 | 3.5e-02 | 338 | 72 | 8 (show) | |
hsa04910:Insulin signaling pathway | see mapped genes |
| 0.14300 | 6.6e-04 | 338 | 136 | 16 (show) | |
hsa04710:Circadian rhythm | see mapped genes |
| 0.14276 | 1.0e+00 | 338 | 12 | 1 (show) | |
hsa04912:GnRH signaling pathway | see mapped genes |
| 0.11388 | 1.4e-01 | 338 | 97 | 8 (show) | |
hsa04810:Regulation of actin cytoskeleton | see mapped genes |
| 0.11310 | 2.0e-03 | 338 | 203 | 19 (show) | |
hsa04010:MAPK signaling pathway | see mapped genes |
| 0.08568 | 1.7e-03 | 338 | 252 | 22 (show) | |
hsa04120:Ubiquitin mediated proteolysis | see mapped genes |
| 0.08266 | 2.1e-02 | 338 | 111 | 11 (show) | |
hsa04310:Wnt signaling pathway | see mapped genes |
| 0.07987 | 3.7e-01 | 338 | 146 | 9 (show) | |
hsa04730:Long-term depression | see mapped genes |
| 0.07475 | 1.1e-01 | 338 | 74 | 7 (show) | |
hsa04930:Type II diabetes mellitus | see mapped genes |
| 0.06776 | 7.3e-01 | 338 | 44 | 3 (show) | |
hsa04540:Gap junction | see mapped genes |
| 0.06438 | 1.6e-02 | 338 | 90 | 10 (show) | |
hsa04650:Natural killer cell mediated cytotoxicity | see mapped genes |
| 0.06383 | 4.4e-02 | 338 | 126 | 11 (show) | |
hsa04350:TGF-beta signaling pathway | see mapped genes |
| 0.04857 | 1.0e+00 | 338 | 85 | 4 (show) | |
hsa04530:Tight junction | see mapped genes |
| 0.04577 | 4.5e-02 | 338 | 127 | 11 (show) | |
hsa04670:Leukocyte transendothelial migration | see mapped genes |
| 0.04351 | 4.6e-01 | 338 | 113 | 7 (show) | |
hsa04340:Hedgehog signaling pathway | see mapped genes |
| 0.04231 | 1.0e+00 | 338 | 55 | 2 (show) | |
hsa05120:Epithelial cell signaling in Helicobacter pylori infection | see mapped genes |
| 0.02391 | 3.2e-01 | 338 | 61 | 5 (show) | |
hsa04640:Hematopoietic cell lineage | see mapped genes |
| 0.01997 | 1.0e+00 | 338 | 91 | 3 (show) | |
hsa05130:Pathogenic Escherichia coli infection - EHEC | see mapped genes |
| 0.01763 | 3.8e-01 | 338 | 47 | 4 (show) | |
hsa05131:Pathogenic Escherichia coli infection - EPEC | see mapped genes |
| 0.01763 | 3.8e-01 | 338 | 47 | 4 (show) | |
hsa05060:Prion disease | see mapped genes |
| 0.00484 | 1.0e+00 | 338 | 13 | 1 (show) | |
hsa04620:Toll-like receptor signaling pathway | see mapped genes |
| 0.00377 | 5.0e-01 | 338 | 95 | 6 (show) | |
hsa00592:alpha-Linolenic acid metabolism | see mapped genes |
| -0.00098 | 1.0e+00 | 338 | 14 | 0 | |
hsa03050:Proteasome | see mapped genes |
| -0.00098 | 1.0e+00 | 338 | 21 | 0 | |
hsa05050:Dentatorubropallidoluysian atrophy (DRPLA) | see mapped genes |
| -0.00098 | 1.0e+00 | 338 | 14 | 0 | |
hsa04060:Cytokine-cytokine receptor interaction | see mapped genes |
| -0.02046 | 2.6e-01 | 338 | 240 | 14 (show) | |
hsa00534:Heparan sulfate biosynthesis | see mapped genes |
| -0.02999 | 4.1e-01 | 338 | 15 | 2 (show) | |
hsa00562:Inositol phosphate metabolism | see mapped genes |
| -0.03750 | 1.0e+00 | 338 | 43 | 2 (show) | |
hsa04020:Calcium signaling pathway | see mapped genes |
| -0.04160 | 1.0e+00 | 338 | 172 | 6 (show) | |
hsa04070:Phosphatidylinositol signaling system | see mapped genes |
| -0.04769 | 1.0e+00 | 338 | 69 | 3 (show) | |
hsa04950:Maturity onset diabetes of the young | see mapped genes |
| -0.04817 | 1.0e+00 | 338 | 24 | 0 | |
hsa04360:Axon guidance | see mapped genes |
| -0.04873 | 5.6e-01 | 338 | 122 | 7 (show) | |
hsa03022:Basal transcription factors | see mapped genes |
| -0.05976 | 1.0e+00 | 338 | 29 | 0 | |
hsa03320:PPAR signaling pathway | see mapped genes |
| -0.06546 | 1.0e+00 | 338 | 69 | 2 (show) | |
hsa00240:Pyrimidine metabolism | see mapped genes |
| -0.09615 | 1.0e+00 | 338 | 78 | 1 (show) | |
hsa00565:Ether lipid metabolism | see mapped genes |
| -0.09864 | 1.0e+00 | 338 | 29 | 1 (show) | |
hsa00230:Purine metabolism | see mapped genes |
| -0.10160 | 1.0e+00 | 338 | 136 | 3 (show) | |
hsa04512:ECM-receptor interaction | see mapped genes |
| -0.10585 | 1.0e+00 | 338 | 82 | 1 (show) | |
hsa00670:One carbon pool by folate | see mapped genes |
| -0.10657 | 1.0e+00 | 338 | 16 | 1 (show) | |
hsa03030:DNA polymerase | see mapped genes |
| -0.12150 | 1.0e+00 | 338 | 24 | 0 | |
hsa03020:RNA polymerase | see mapped genes |
| -0.12281 | 1.0e+00 | 338 | 19 | 0 | |
hsa05010:Alzheimer's disease | see mapped genes |
| -0.12507 | 1.0e+00 | 338 | 28 | 0 | |
hsa04514:Cell adhesion molecules (CAMs) | see mapped genes |
| -0.12995 | 1.0e+00 | 338 | 133 | 1 (show) | |
hsa03010:Ribosome | see mapped genes |
| -0.13718 | 1.0e+00 | 338 | 64 | 0 | |
hsa04614:Renin-angiotensin system | see mapped genes |
| -0.13773 | 1.0e+00 | 338 | 17 | 0 | |
hsa05110:Cholera - Infection | see mapped genes |
| -0.16305 | 1.0e+00 | 338 | 36 | 1 (show) | |
hsa04940:Type I diabetes mellitus | see mapped genes |
| -0.16681 | 1.0e+00 | 338 | 48 | 2 (show) | |
hsa00271:Methionine metabolism | see mapped genes |
| -0.16850 | 1.0e+00 | 338 | 14 | 0 | |
hsa00710:Carbon fixation | see mapped genes |
| -0.16850 | 1.0e+00 | 338 | 21 | 0 | |
hsa05020:Parkinson's disease | see mapped genes |
| -0.16850 | 1.0e+00 | 338 | 21 | 0 | |
hsa04612:Antigen processing and presentation | see mapped genes |
| -0.16861 | 1.0e+00 | 338 | 79 | 2 (show) | |
hsa00790:Folate biosynthesis | see mapped genes |
| -0.16874 | 1.0e+00 | 338 | 37 | 2 (show) | |
hsa00680:Methane metabolism | see mapped genes |
| -0.17732 | 1.0e+00 | 338 | 10 | 0 | |
hsa00272:Cysteine metabolism | see mapped genes |
| -0.18480 | 1.0e+00 | 338 | 17 | 1 (show) | |
hsa00252:Alanine and aspartate metabolism | see mapped genes |
| -0.20611 | 1.0e+00 | 338 | 26 | 0 | |
hsa04740:Olfactory transduction | see mapped genes |
| -0.21158 | 1.0e+00 | 338 | 31 | 0 | |
hsa00960:Alkaloid biosynthesis II | see mapped genes |
| -0.21279 | 1.0e+00 | 338 | 14 | 1 (show) | |
hsa00251:Glutamate metabolism | see mapped genes |
| -0.21291 | 1.0e+00 | 338 | 28 | 1 (show) | |
hsa00903:Limonene and pinene degradation | see mapped genes |
| -0.21473 | 1.0e+00 | 338 | 25 | 1 (show) | |
hsa00310:Lysine degradation | see mapped genes |
| -0.22088 | 1.0e+00 | 338 | 46 | 1 (show) | |
hsa00500:Starch and sucrose metabolism | see mapped genes |
| -0.22102 | 1.0e+00 | 338 | 64 | 2 (show) | |
hsa00640:Propanoate metabolism | see mapped genes |
| -0.22434 | 1.0e+00 | 338 | 32 | 0 | |
hsa04080:Neuroactive ligand-receptor interaction | see mapped genes |
| -0.22583 | 1.0e+00 | 338 | 250 | 1 (show) | |
hsa00190:Oxidative phosphorylation | see mapped genes |
| -0.22996 | 1.0e+00 | 338 | 106 | 4 (show) | |
hsa00030:Pentose phosphate pathway | see mapped genes |
| -0.24029 | 1.0e+00 | 338 | 25 | 0 | |
hsa00521:Streptomycin biosynthesis | see mapped genes |
| -0.24029 | 1.0e+00 | 338 | 10 | 0 | |
hsa00620:Pyruvate metabolism | see mapped genes |
| -0.24970 | 1.0e+00 | 338 | 41 | 0 | |
hsa00630:Glyoxylate and dicarboxylate metabolism | see mapped genes |
| -0.25101 | 1.0e+00 | 338 | 12 | 0 | |
hsa00561:Glycerolipid metabolism | see mapped genes |
| -0.25459 | 1.0e+00 | 338 | 45 | 0 | |
hsa00564:Glycerophospholipid metabolism | see mapped genes |
| -0.25739 | 1.0e+00 | 338 | 61 | 1 (show) | |
hsa00860:Porphyrin and chlorophyll metabolism | see mapped genes |
| -0.26179 | 1.0e+00 | 338 | 30 | 0 | |
hsa00360:Phenylalanine metabolism | see mapped genes |
| -0.26676 | 1.0e+00 | 338 | 25 | 1 (show) | |
hsa00626:Naphthalene and anthracene degradation | see mapped genes |
| -0.26901 | 1.0e+00 | 338 | 18 | 0 | |
hsa00010:Glycolysis / Gluconeogenesis | see mapped genes |
| -0.27263 | 1.0e+00 | 338 | 60 | 0 | |
hsa00591:Linoleic acid metabolism | see mapped genes |
| -0.27368 | 1.0e+00 | 338 | 31 | 0 | |
hsa00632:Benzoate degradation via CoA ligation | see mapped genes |
| -0.27893 | 1.0e+00 | 338 | 24 | 1 (show) | |
hsa00910:Nitrogen metabolism | see mapped genes |
| -0.28004 | 1.0e+00 | 338 | 21 | 0 | |
hsa01430:Cell Communication | see mapped genes |
| -0.28343 | 1.0e+00 | 338 | 123 | 1 (show) | |
hsa00361:gamma-Hexachlorocyclohexane degradation | see mapped genes |
| -0.28980 | 1.0e+00 | 338 | 21 | 0 | |
hsa00590:Arachidonic acid metabolism | see mapped genes |
| -0.29058 | 1.0e+00 | 338 | 51 | 0 | |
hsa00624:1- and 2-Methylnaphthalene degradation | see mapped genes |
| -0.29099 | 1.0e+00 | 338 | 21 | 1 (show) | |
hsa00071:Fatty acid metabolism | see mapped genes |
| -0.29172 | 1.0e+00 | 338 | 46 | 1 (show) | |
hsa00220:Urea cycle and metabolism of amino groups | see mapped genes |
| -0.29414 | 1.0e+00 | 338 | 29 | 0 | |
hsa04610:Complement and coagulation cascades | see mapped genes |
| -0.29609 | 1.0e+00 | 338 | 70 | 0 | |
hsa00052:Galactose metabolism | see mapped genes |
| -0.30556 | 1.0e+00 | 338 | 32 | 0 | |
hsa00603:Glycosphingolipid biosynthesis - globoseries | see mapped genes |
| -0.30556 | 1.0e+00 | 338 | 14 | 0 | |
hsa00760:Nicotinate and nicotinamide metabolism | see mapped genes |
| -0.30556 | 1.0e+00 | 338 | 24 | 0 | |
hsa01040:Polyunsaturated fatty acid biosynthesis | see mapped genes |
| -0.30556 | 1.0e+00 | 338 | 12 | 0 | |
hsa04140:Regulation of autophagy | see mapped genes |
| -0.30556 | 1.0e+00 | 338 | 22 | 0 | |
hsa00350:Tyrosine metabolism | see mapped genes |
| -0.31246 | 1.0e+00 | 338 | 53 | 1 (show) | |
hsa00410:beta-Alanine metabolism | see mapped genes |
| -0.32006 | 1.0e+00 | 338 | 23 | 0 | |
hsa00380:Tryptophan metabolism | see mapped genes |
| -0.32377 | 1.0e+00 | 338 | 55 | 0 | |
hsa00140:C21-Steroid hormone metabolism | see mapped genes |
| -0.32516 | 1.0e+00 | 338 | 12 | 0 | |
hsa00330:Arginine and proline metabolism | see mapped genes |
| -0.32644 | 1.0e+00 | 338 | 32 | 0 | |
hsa04130:SNARE interactions in vesicular transport | see mapped genes |
| -0.32644 | 1.0e+00 | 338 | 32 | 0 | |
hsa04742:Taste transduction | see mapped genes |
| -0.32859 | 1.0e+00 | 338 | 46 | 1 (show) | |
hsa00040:Pentose and glucuronate interconversions | see mapped genes |
| -0.35365 | 1.0e+00 | 338 | 14 | 0 | |
hsa00280:Valine, leucine and isoleucine degradation | see mapped genes |
| -0.35365 | 1.0e+00 | 338 | 42 | 0 | |
hsa00480:Glutathione metabolism | see mapped genes |
| -0.35510 | 1.0e+00 | 338 | 34 | 2 (show) | |
hsa00970:Aminoacyl-tRNA biosynthesis | see mapped genes |
| -0.36161 | 1.0e+00 | 338 | 31 | 1 (show) | |
hsa00600:Sphingolipid metabolism | see mapped genes |
| -0.36179 | 1.0e+00 | 338 | 36 | 0 | |
hsa00051:Fructose and mannose metabolism | see mapped genes |
| -0.36318 | 1.0e+00 | 338 | 41 | 0 | |
hsa00510:N-Glycan biosynthesis | see mapped genes |
| -0.36833 | 1.0e+00 | 338 | 34 | 1 (show) | |
hsa00440:Aminophosphonate metabolism | see mapped genes |
| -0.37324 | 1.0e+00 | 338 | 15 | 0 | |
hsa00512:O-Glycan biosynthesis | see mapped genes |
| -0.37324 | 1.0e+00 | 338 | 25 | 0 | |
hsa02010:ABC transporters - General | see mapped genes |
| -0.37896 | 1.0e+00 | 338 | 39 | 0 | |
hsa00650:Butanoate metabolism | see mapped genes |
| -0.37948 | 1.0e+00 | 338 | 40 | 0 | |
hsa01030:Glycan structures - biosynthesis 1 | see mapped genes |
| -0.37979 | 1.0e+00 | 338 | 99 | 3 (show) | |
hsa00531:Glycosaminoglycan degradation | see mapped genes |
| -0.37980 | 1.0e+00 | 338 | 17 | 0 | |
hsa00150:Androgen and estrogen metabolism | see mapped genes |
| -0.38863 | 1.0e+00 | 338 | 45 | 0 | |
hsa00100:Biosynthesis of steroids | see mapped genes |
| -0.39056 | 1.0e+00 | 338 | 24 | 0 | |
hsa00363:Bisphenol A degradation | see mapped genes |
| -0.40302 | 1.0e+00 | 338 | 14 | 0 | |
hsa00260:Glycine, serine and threonine metabolism | see mapped genes |
| -0.40885 | 1.0e+00 | 338 | 43 | 0 | |
hsa00340:Histidine metabolism | see mapped genes |
| -0.41407 | 1.0e+00 | 338 | 37 | 0 | |
hsa00604:Glycosphingolipid biosynthesis - ganglioseries | see mapped genes |
| -0.41977 | 1.0e+00 | 338 | 15 | 0 | |
hsa00740:Riboflavin metabolism | see mapped genes |
| -0.41977 | 1.0e+00 | 338 | 15 | 0 | |
hsa00930:Caprolactam degradation | see mapped genes |
| -0.41977 | 1.0e+00 | 338 | 15 | 0 | |
hsa00120:Bile acid biosynthesis | see mapped genes |
| -0.42615 | 1.0e+00 | 338 | 37 | 0 | |
hsa00602:Glycosphingolipid biosynthesis - neo-lactoseries | see mapped genes |
| -0.43221 | 1.0e+00 | 338 | 19 | 0 | |
hsa00450:Selenoamino acid metabolism | see mapped genes |
| -0.43981 | 1.0e+00 | 338 | 25 | 0 | |
hsa00062:Fatty acid elongation in mitochondria | see mapped genes |
| -0.44348 | 1.0e+00 | 338 | 10 | 0 | |
hsa00641:3-Chloroacrylic acid degradation | see mapped genes |
| -0.45373 | 1.0e+00 | 338 | 14 | 0 | |
hsa00530:Aminosugars metabolism | see mapped genes |
| -0.46563 | 1.0e+00 | 338 | 26 | 0 | |
hsa00980:Metabolism of xenobiotics by cytochrome P450 | see mapped genes |
| -0.47286 | 1.0e+00 | 338 | 54 | 0 | |
hsa01032:Glycan structures - degradation | see mapped genes |
| -0.49705 | 1.0e+00 | 338 | 32 | 0 | |
hsa00532:Chondroitin sulfate biosynthesis | see mapped genes |
| -0.51642 | 1.0e+00 | 338 | 20 | 0 | |
hsa01031:Glycan structures - biosynthesis 2 | see mapped genes |
| -0.52769 | 1.0e+00 | 338 | 52 | 0 | |
hsa00511:N-Glycan degradation | see mapped genes |
| -0.55126 | 1.0e+00 | 338 | 17 | 0 | |
hsa00920:Sulfur metabolism | see mapped genes |
| -0.55937 | 1.0e+00 | 338 | 14 | 0 | |
hsa00533:Keratan sulfate biosynthesis | see mapped genes |
| -0.57299 | 1.0e+00 | 338 | 16 | 0 | |
hsa00770:Pantothenate and CoA biosynthesis | see mapped genes |
| -0.59202 | 1.0e+00 | 338 | 16 | 0 | |
hsa00130:Ubiquinone biosynthesis | see mapped genes |
| -0.62776 | 1.0e+00 | 338 | 11 | 0 | |
hsa00563:Glycosylphosphatidylinositol(GPI)-anchor biosynthesis | see mapped genes |
| -0.63442 | 1.0e+00 | 338 | 13 | 0 | |